View the video of this post here.
Don’t miss the next post.
Subscribe to The Week in Charts Here to get it directly in your inbox.
The State of the Markets…
1) More All-Time Highs But a Narrowing Advance
The S&P 500 closed at a record high last week for the first time since August, hitting its 28th all-time high of the year.
But while large cap stocks have continued their advance, smaller companies are in the midst of a nearly 10% correction.
Just two months ago, small caps (Russell 2000) were up over 24% on the year, outperforming large caps (S&P 500) by 10 percentage points.
Today, large cap stocks have taken the lead for the first time in 2026.
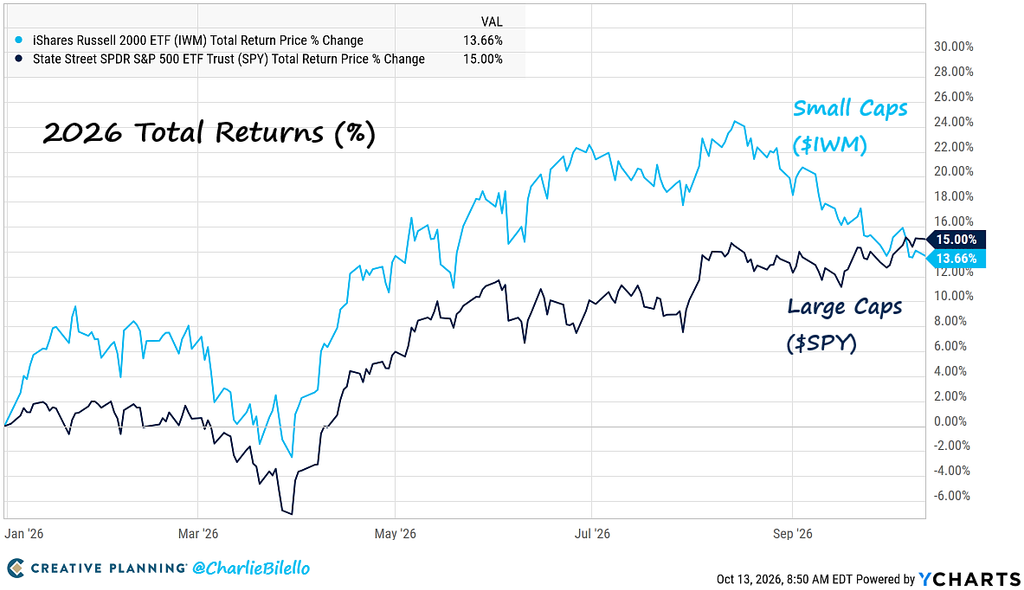
What changed? Rapidly rising interest rates and the expectation that higher borrowing costs are going to disproportionately hurt smaller companies.
The same is true for the average stock in the S&P 500, the index of which is now at its lowest level relative to the cap-weighted index since November 2002.
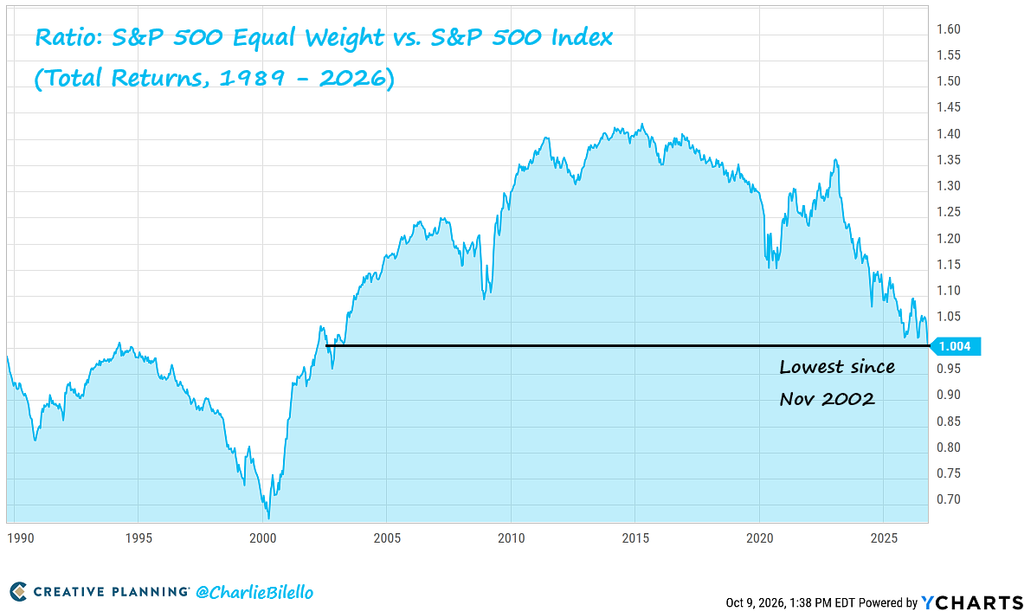
That’s over 23 years of relative outperformance erased.
The dominance of a handful of mega-cap stocks continues to be the most persistent theme over the past decade plus.
2) Big Tech Rules the World … Again
Within the mega-cap segment, no sector has been more important than technology.
And every time it seems like a secular reversal is about to happen, tech stocks come roaring back.
The relative strength of the technology sector hit another all-time high this month.
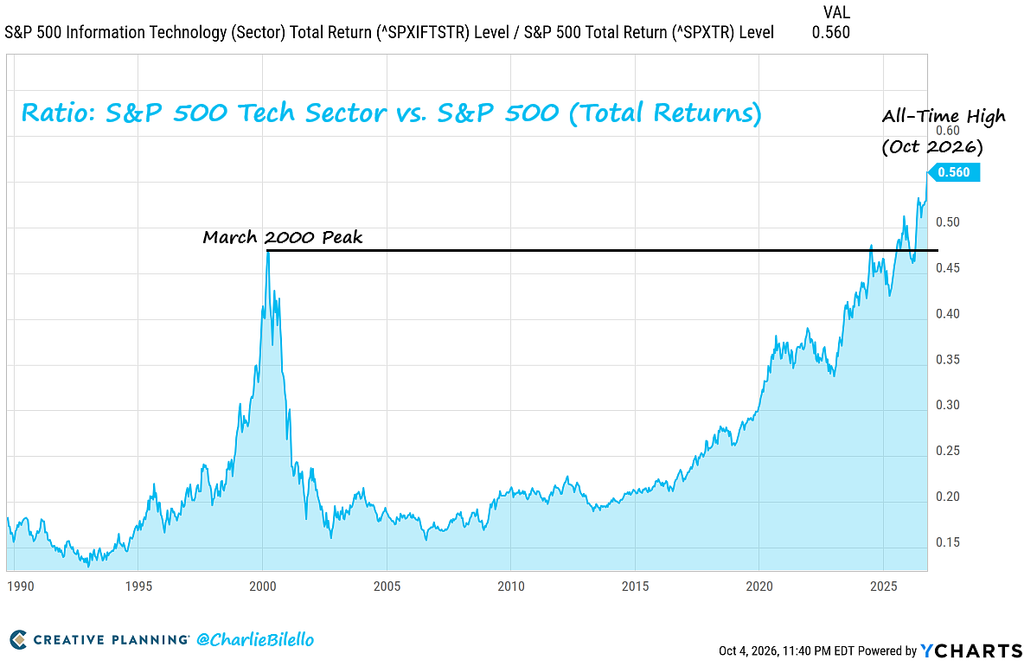
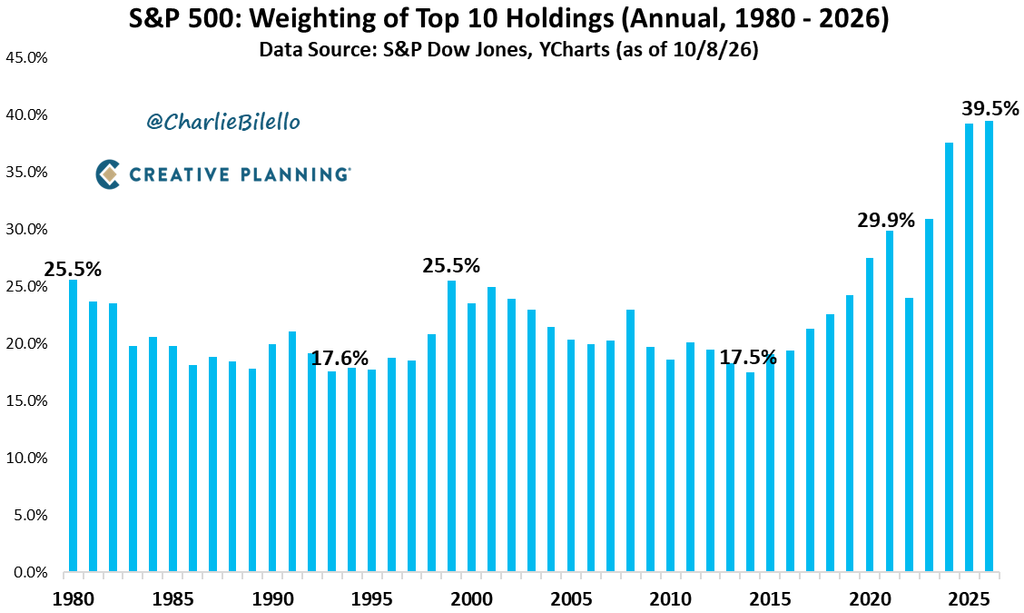
And the top 10 holdings in the S&P 500 (most of which are in the tech sector) now make up 39.5% of the index, the highest concentration we’ve seen with data going back to 1980.
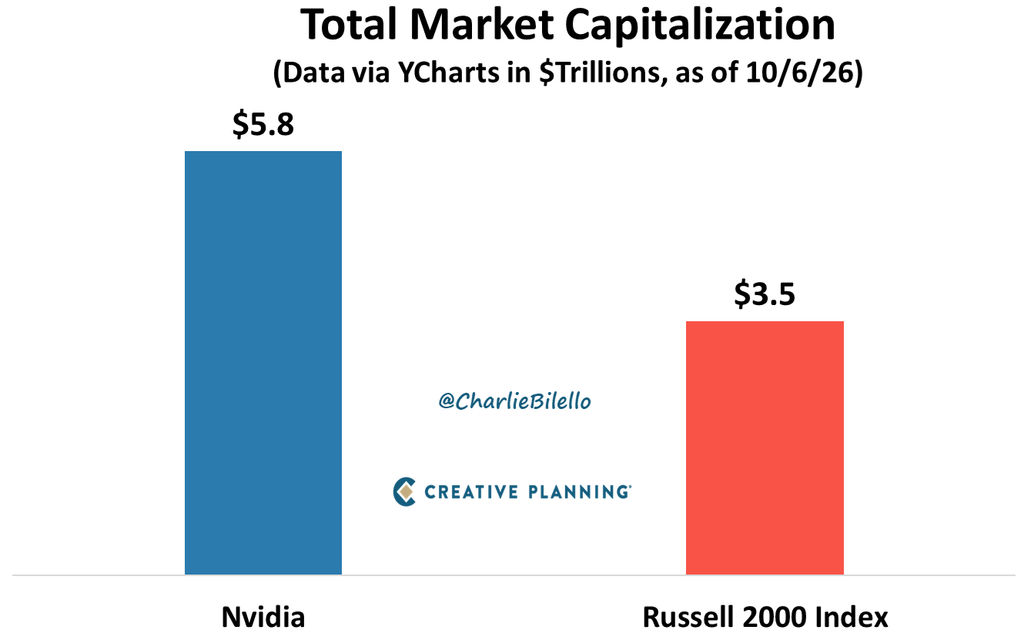
Nvidia’s market cap of $5.8 trillion is over $2 trillion higher than all of the companies in the Russell 2000 combined.
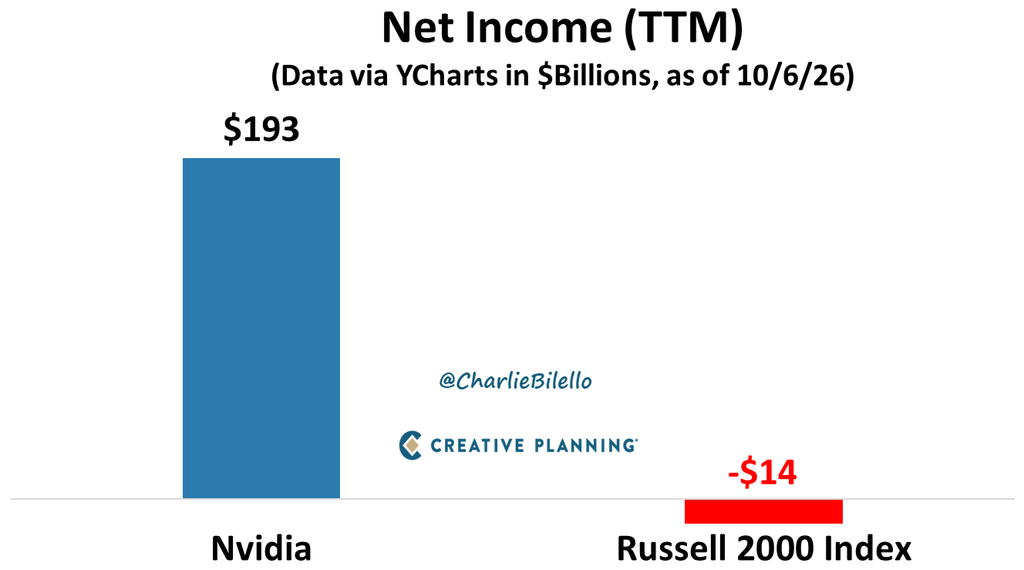
That seems absolutely crazy until you learn that Nvidia made a profit of $193 billion over the last year while the Russell 2000 members collectively lost $14 billion.
3) The Earnings Boom: Expected to Continue in 2027
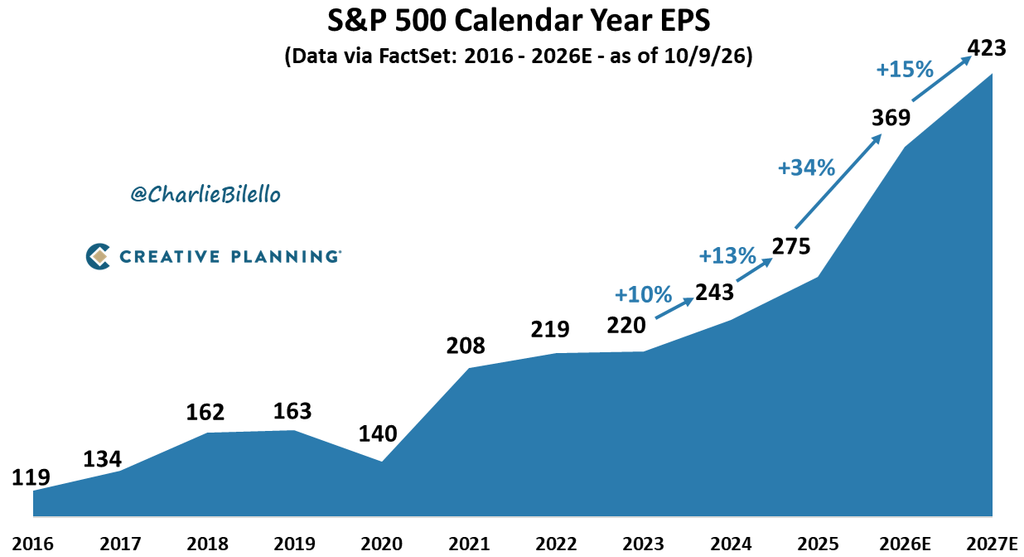
The S&P 500’s earnings boom is simply unprecedented this late into an economic cycle.
Profits are on pace to surge 34% this year followed by another 15% gain expected in 2027.
That would be 54% growth in just 2 years.
4) TINA Is Dead
TINA (there is no alternative) is dead.
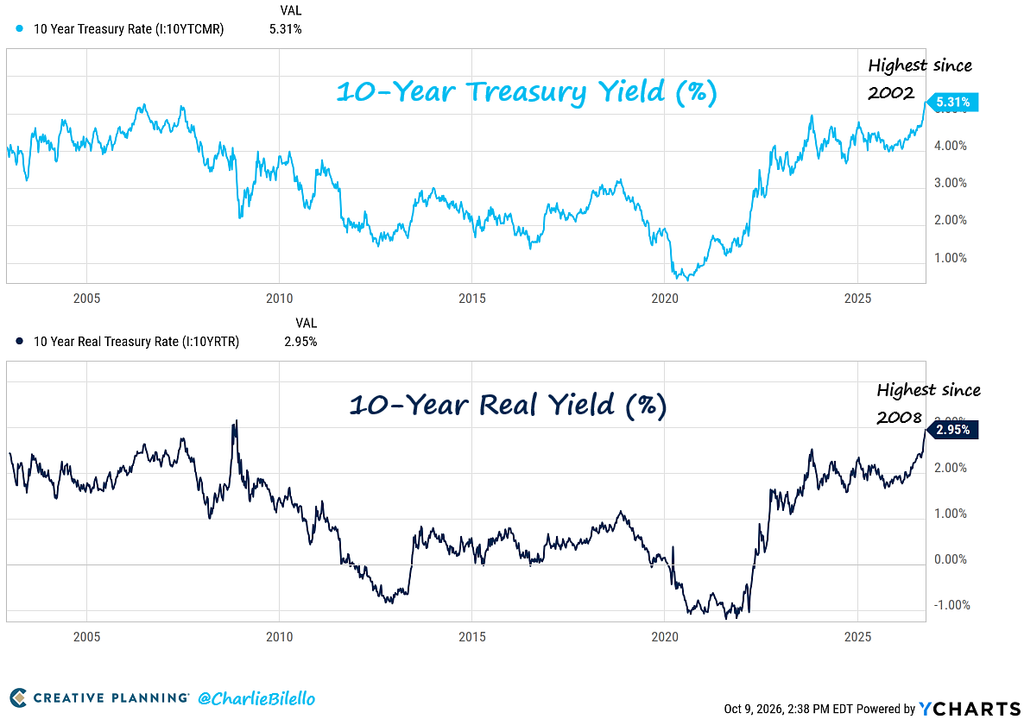
For years, investors were told there was no alternative to stocks. And that saying had a lot of truth to it back in 2020 when long-term bond yield were below 1% and real yields were negative.
But what a difference 6 years makes. Today we have the highest nominal yields since 2002 (5.31%) and the highest real yields since 2008.
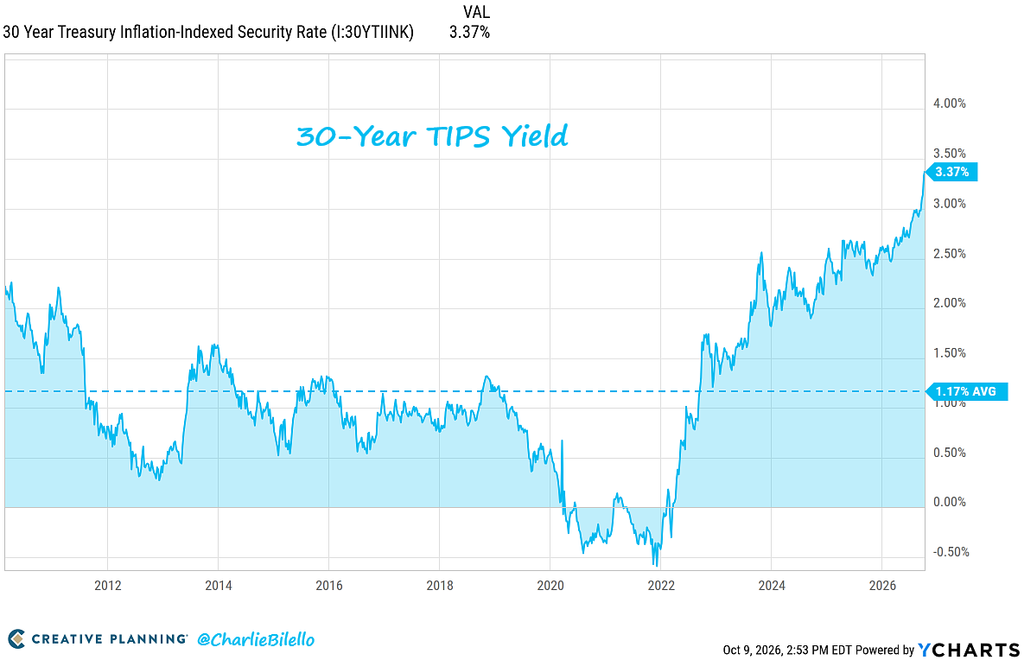
And 30-year inflation-protected Treasury bonds offer a 3.37% yield ABOVE inflation, the highest real yield in over 20 years.
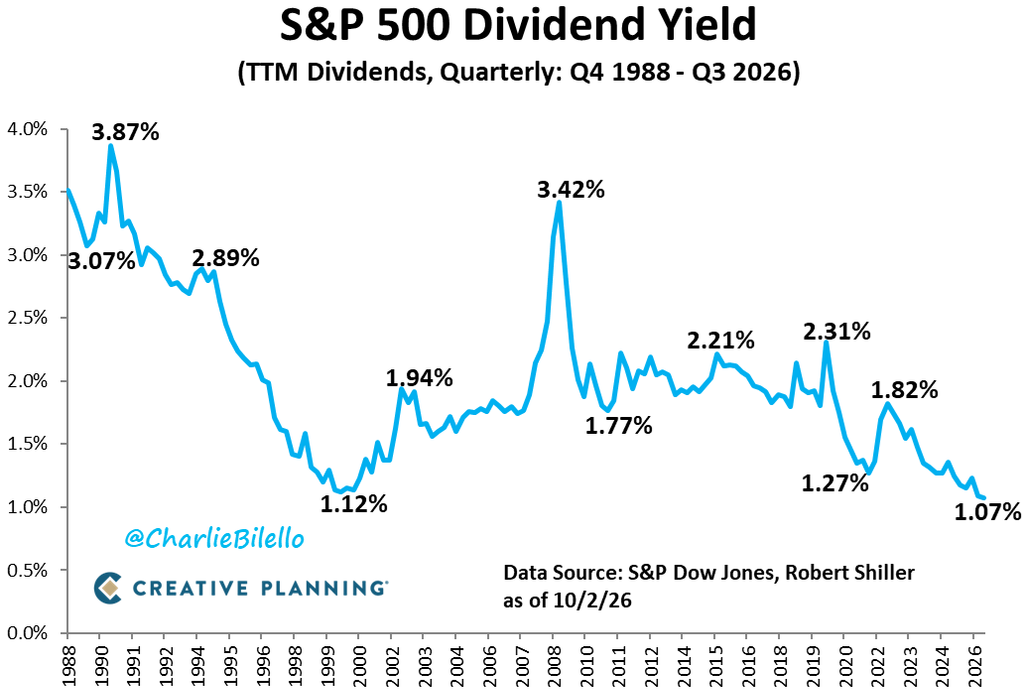
At the same time, the S&P 500’s dividend yield has fallen to an all-time low of 1.07%.
There is an alternative now.
5) A Gap That’s Unlikely to Repeat
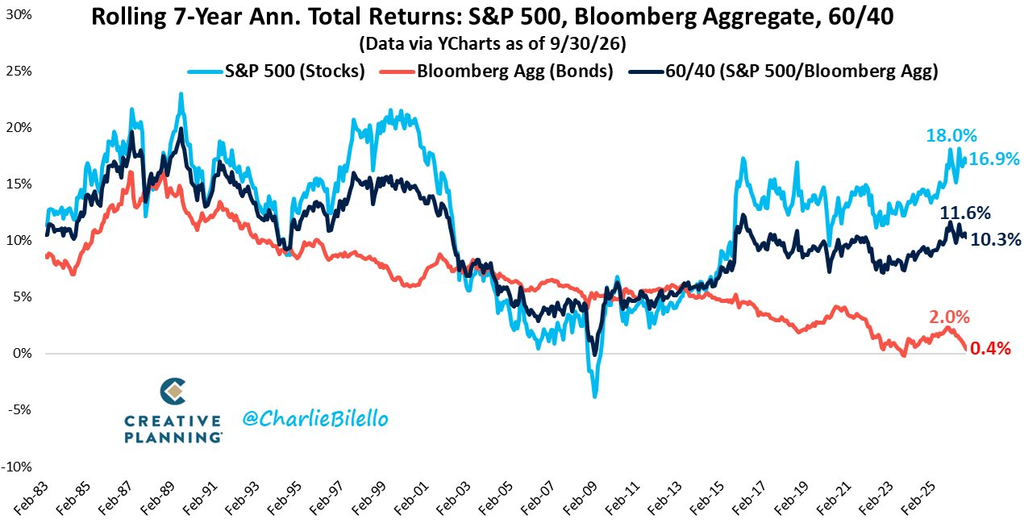
The gap between stock and bond returns has never been wider.
Over the 7 years…
S&P 500: +16.9% annualized
US Bonds: +0.4% annualized
That’s a nearly 17% spread, the largest on record. Investors shouldn’t expect a repeat over the next 7 years.
Why?
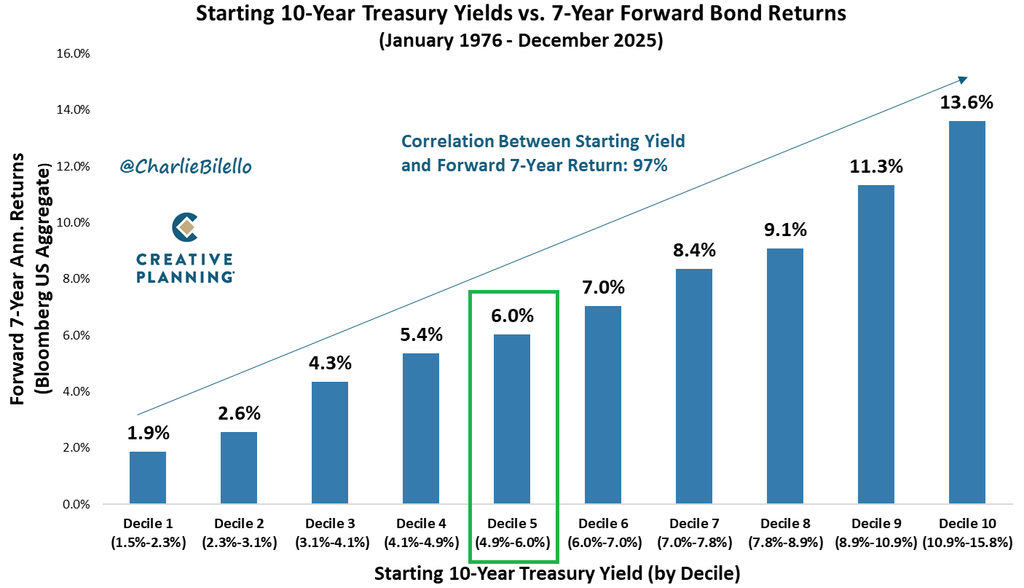
While stock returns are impossible to predict, the prospective returns for bonds are the highest they’ve been in 24 years…
6) The Real Estate Round Trip
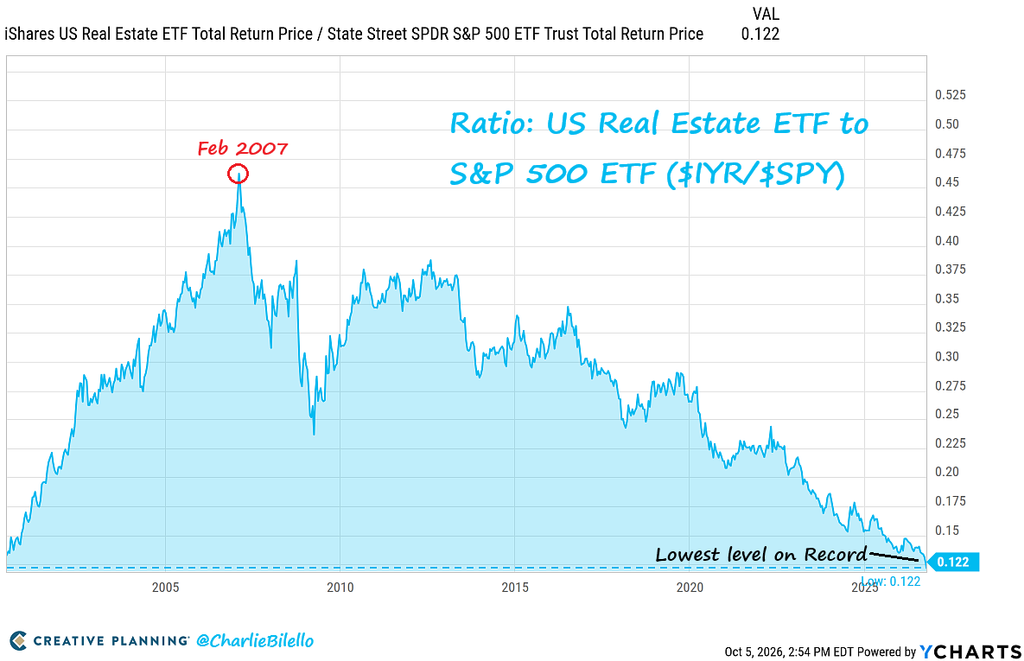
US real estate stocks are now at their lowest level ever relative to the S&P 500, erasing all of their relative outperformance from the early-to-mid 2000s housing bubble.
7) Fight the Fed Narrative
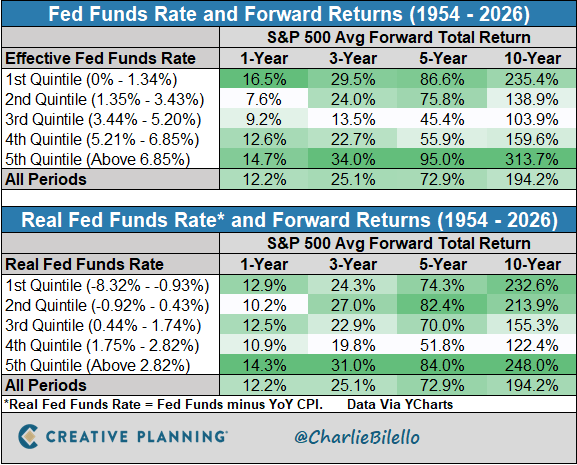
“Don’t fight the Fed” is one of the biggest myths in investing.
The S&P 500 has delivered strong average forward returns across every interest rate environment.
High rates, low rates, easy policy, tight policy.
The stock market doesn’t care nearly as much about Fed policy as most investors think.
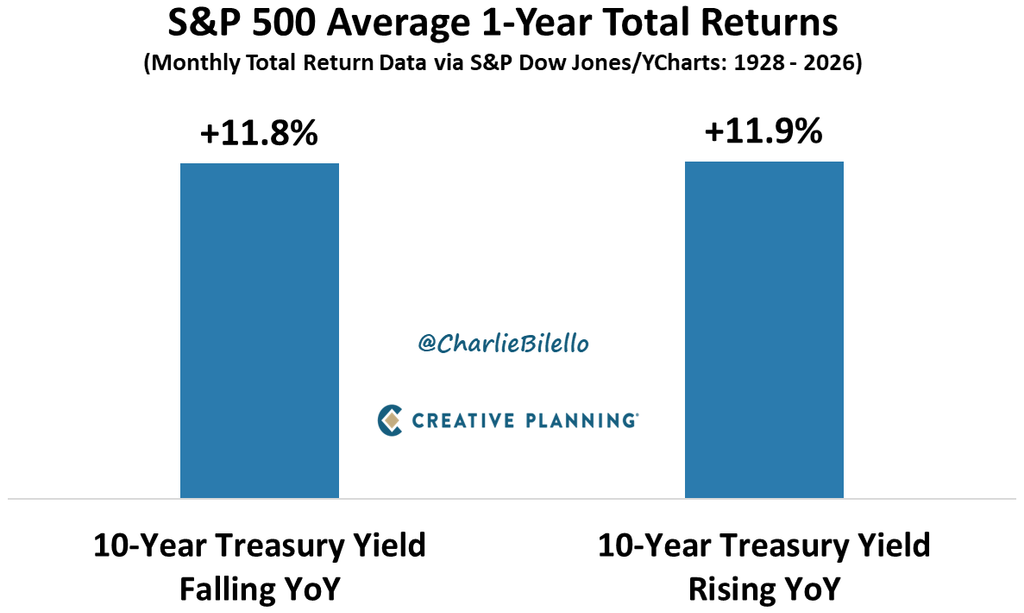
Investors are constantly told to fear rising interest rates.
But history tells a different story.
Since 1928, the S&P 500 has averaged virtually identical annual returns during periods of rising and falling Treasury yields.
8) A Stunning Spread
There’s a stunning 56% spread between the best and worst performing S&P 500 sectors so far this year:
-Energy: +51%
-Consumer Discretionary: -5%
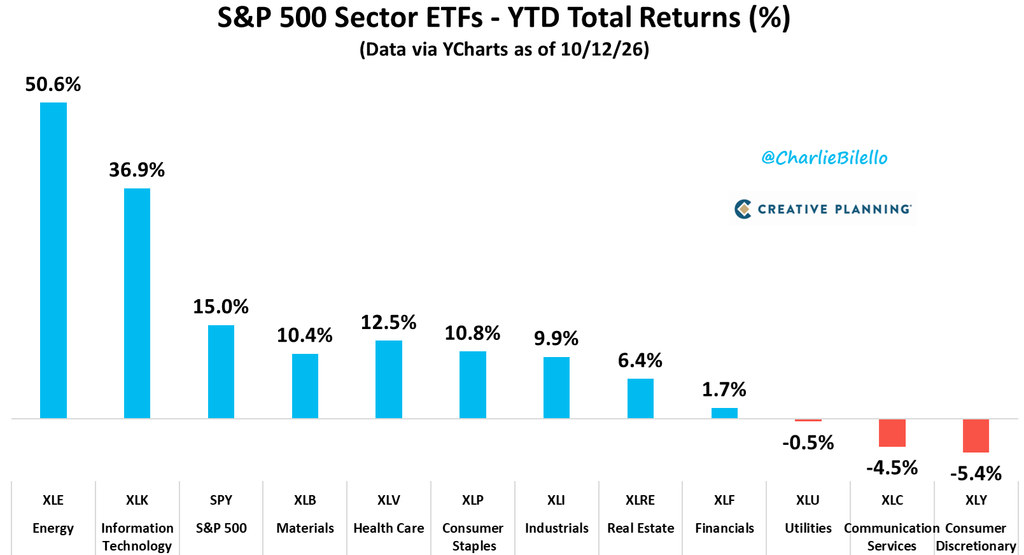
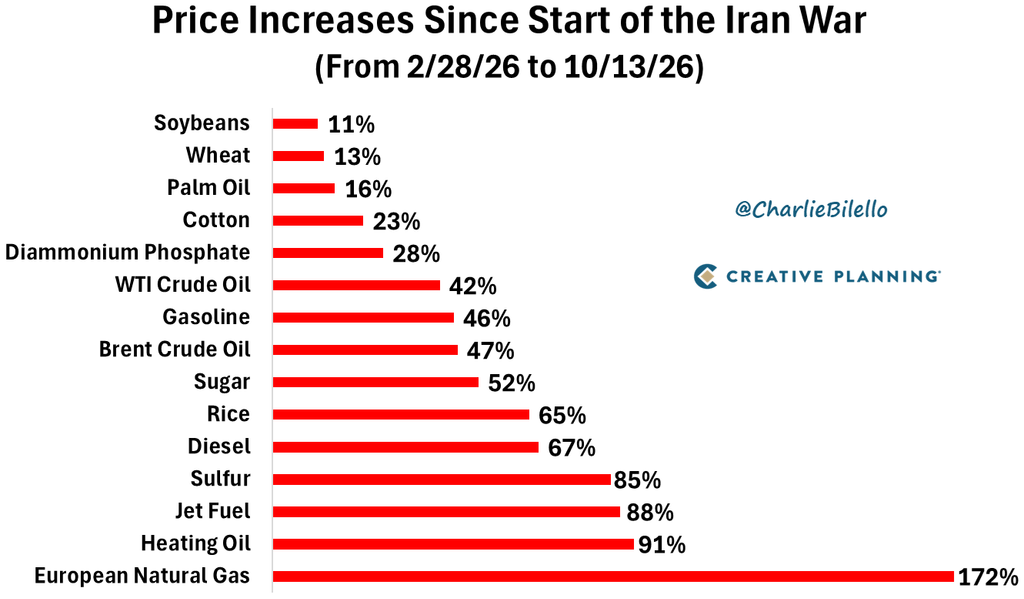
What’s going on here?
War-driven inflation is rewarding big oil companies and squeezing the US consumer.
9) The AI Jobs Apocalypse: Postponed
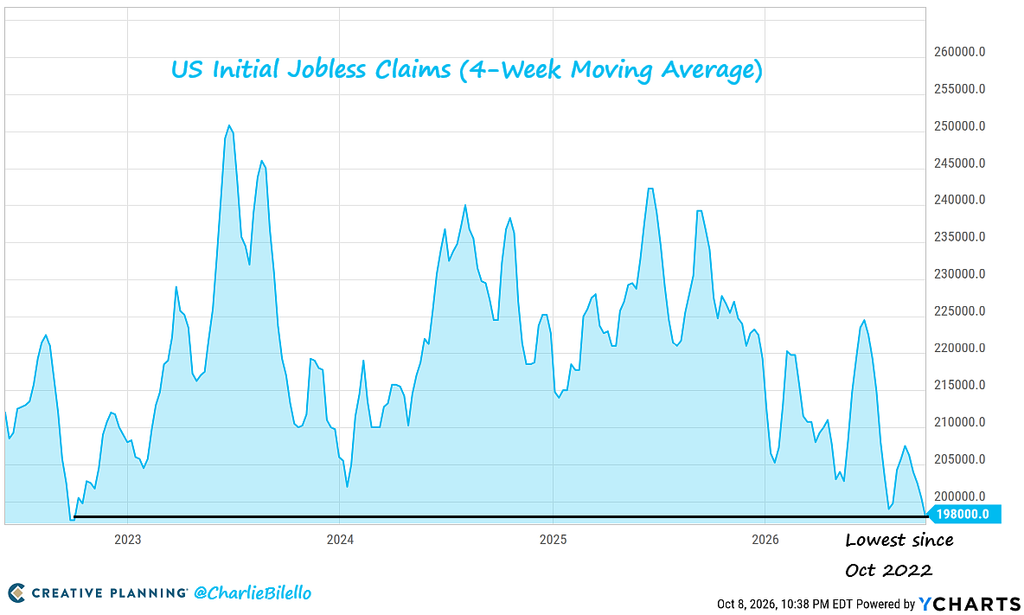
US Jobless Claims have moved down to their lowest levels since October 2022, indicating the fewest people filing for unemployment insurance in four years. And if Jobless Claims move down another 1k from here, we’ll be at the lowest levels since 1969.
AI will inevitably destroy many jobs, but it will also create new ones.
In fact, hundreds of thousands of new AI-related jobs have already been created.
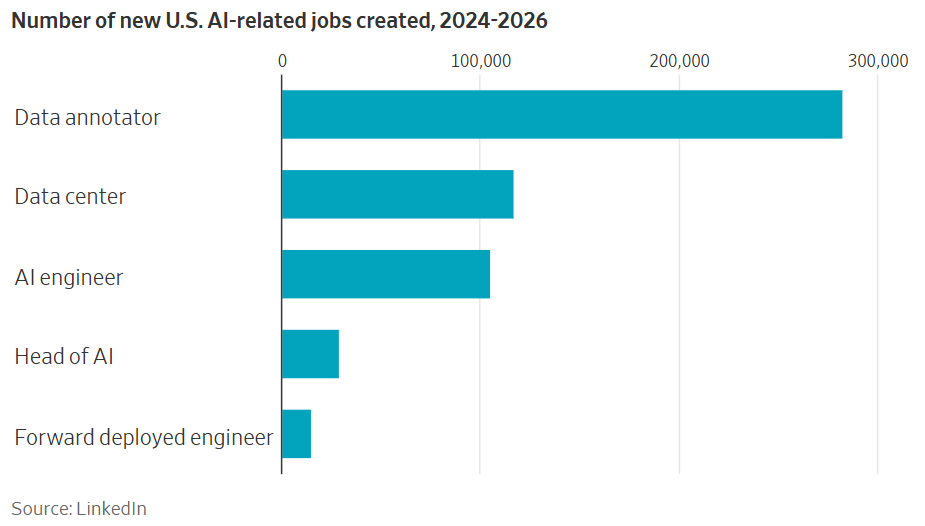
With the AI capex boom accelerating at a staggering pace, expect this list to get much longer.
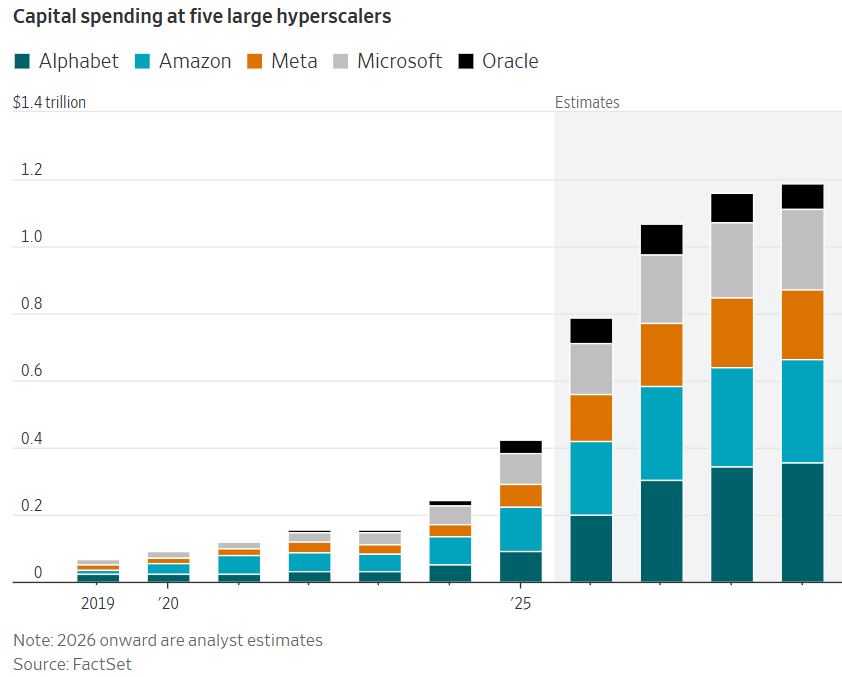
Spending by Alphabet, Amazon, Meta, Microsoft & Oracle is expected to jump from $412 billion in 2025 to $789 billion in 2026.
That’s a 92% increase in just one year.
By 2029, estimated capex from these 5 hyperscalers is nearly $1.2 trillion a year.
10) The Biggest Infrastructure Investment in History
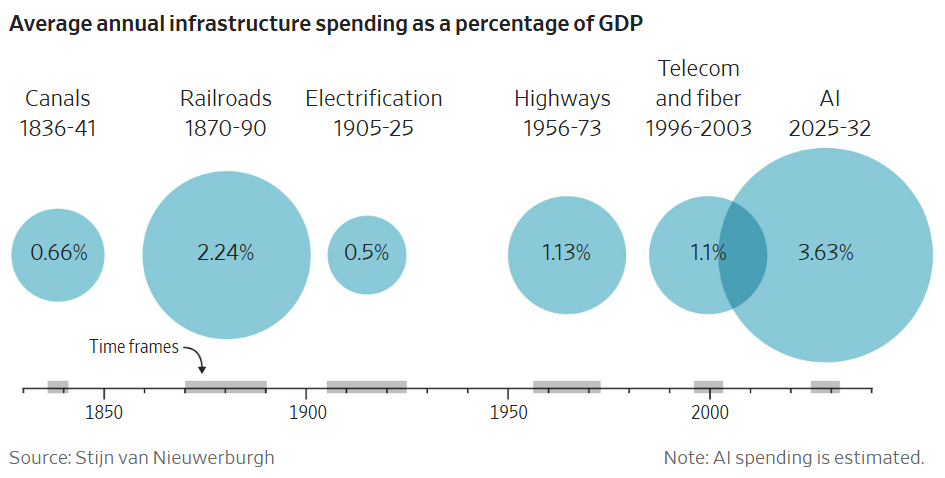
Spending on AI infrastructure is projected to average 3.6% of US GDP in the coming years.
That would represent a higher share of the economy than the investment in Canals (1836-41), Railroads (1870-90) and Electrification (1905-25) … Combined.
And that’s it for this week. Thanks for reading!
Every week I do a video breaking down the most important charts and themes in markets and investing. Subscribe to our YouTube channel HERE for the latest content.
Disclaimer: All information provided is for educational purposes only and does not constitute investment, legal or tax advice, or an offer to buy or sell any security. Read our full disclosures here.
PakarPBN
A Private Blog Network (PBN) is a collection of websites that are controlled by a single individual or organization and used primarily to build backlinks to a “money site” in order to influence its ranking in search engines such as Google. The core idea behind a PBN is based on the importance of backlinks in Google’s ranking algorithm. Since Google views backlinks as signals of authority and trust, some website owners attempt to artificially create these signals through a controlled network of sites.
In a typical PBN setup, the owner acquires expired or aged domains that already have existing authority, backlinks, and history. These domains are rebuilt with new content and hosted separately, often using different IP addresses, hosting providers, themes, and ownership details to make them appear unrelated. Within the content published on these sites, links are strategically placed that point to the main website the owner wants to rank higher. By doing this, the owner attempts to pass link equity (also known as “link juice”) from the PBN sites to the target website.
The purpose of a PBN is to give the impression that the target website is naturally earning links from multiple independent sources. If done effectively, this can temporarily improve keyword rankings, increase organic visibility, and drive more traffic from search results.